The State of Digital Experience Analytics: Key Players & Capabilities

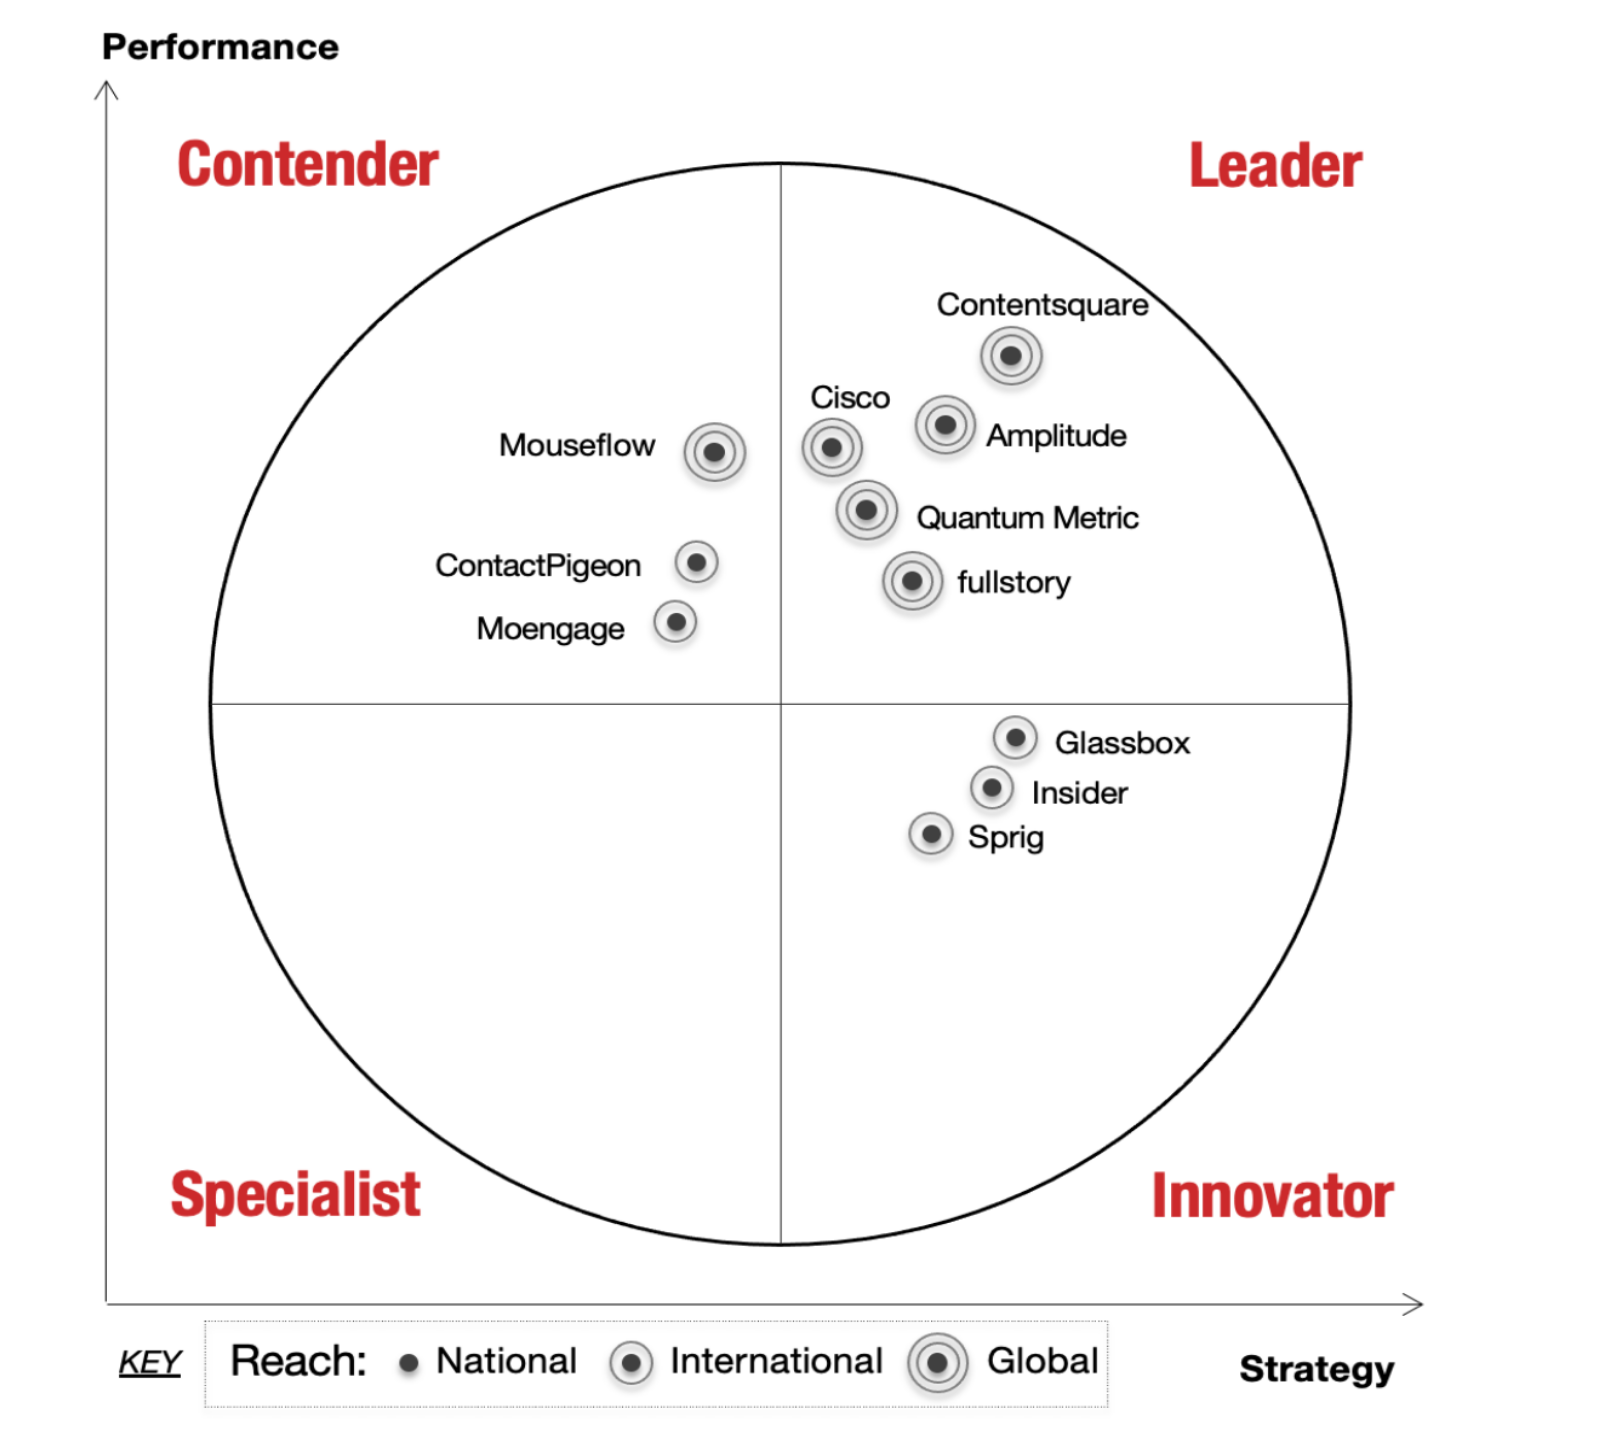
The Aragon Research Globe™ for Digital Experience Analytics, 2024
Featuring Globe Leader: Contentsquare
By 2025, it's predicted that 75% of large businesses using web platforms for online commerce will look to deploy Digital Experience Analytics (DXA) to optimize those experiences. This first of its kind report looks to define the key components of DXA and take a deep-dive look into the key players within the industry to help you stay ahead of the curve & make informed decisions when choosing a vendor.
Within the report you'll find:
- A look into the current state of Digital Experience Analytics including key components
- Why DXA is necessary and how to use it to optimize user journeys
- Vendor comparison of the top 11 players in the industry.
Access the full report
Get exclusive first access to Aragon Research's new DXA Report: Launched April 2024
Make every click count with the #1 enterprise digital experience analytics platform


Contentsquare Named a Leader in The Aragon Research Globe™ for Digital Experience Analytics, 2024
Contentsquare unlocks the power to know —with near certainty—what your customers want and need as they engage with your business online. Our digital experience analytics platform turns insights into actions, empowering you to deliver more human experiences online.
Build business resiliency, grow revenue and maximize ROI with an exceptional digital customer experience.


What's inside?

Predictions & Insights
Get insights on the current and future state of Digital Experience Analytics as companies move toward an "outside-in" perspective when creating their customer journeys. See four key predictions for DXA overall, conversational search, CDP and AI.

Key Components
View all the critical components of DXA mapped out including everything from Understanding with Heatmaps and Customer Journey Analysis, to Analysis with Conversions and Bottlenecks, to Optimizing with Recommendations, Merchandising, etc.
.png?width=125&height=125&name=Team%20_%20people%20HR%20(1).png)
The Leader in DXA's Core Capabilities
Scroll through a few of our products below for a look at how Contentsquare works on your site or app.
If you like what you see, book some time to explore a personalized demo tied to your business KPIs.
Visualize metrics for each page element
Reveal how users interact with each element on your website or app; understand what makes them click, what attracts their attention, and what content makes them bounce. Go beyond basic analytics to understand why your users behave as they do online.
- Analyze heatmaps using our live zoning extension to compare two different test variations, devices, metrics, or customer segments.
- Learn the impact of different user behaviors and optimize based on what brings your business the most value.
Compare your digital experience metrics against anonymized industry peers
Say goodbye to outdated reports and embrace the power of timely, data-driven decision-making. Benchmarks enables you to effortlessly access and compare your site's metrics with anonymized industry peers in real-time so you know where you stand against your competitors.
-
Trillions of behaviors analyzed turned into powerful comparative benchmarks.
- Follow site level metrics such as bounce rate, load time, average cart and more for a deeper understanding of your market.
Spot errors and frustrations that cost you revenue
Eliminate customer frustration and recover revenue by identify pain points in the customer journey and enabling your business and technical teams to spot issues and address problems impacting customer experience.
- Prioritize client-side errors, such as Javascript, API failures and more, based on impact to conversion and revenue.
- Identify the top-recurring JavaScript errors ranked by their impact on conversion. Then replay clients’ sessions in Session Replay to identify exactly what caused the error.
Capture 100% of the user experience
Quickly visualize and understand why users are struggling with a particular button, error or a form field by recreating those sessions. Focus data capture on specific behaviors which are most meaningful to your business, such as checkout completions or contact form submissions.
- See where users struggle so you can fix issues on your site—fast and at scale.
- Analyze and quantify issues identified in Voice of Customer systems in a single click.
See how users progress through your site, page by page, from entry to exit
Our Customer Journey Analysis capability aggregates data from 100% of your customer's experience to give you a full picture of their journey on-site, including which pages they visited and in which order.
- Our signature sunburst helps you visualize at a glance your biggest opportunities for improvement, enabling you to make informed, data-driven decisions about where to invest, optimize, or rethink your digital experience.
- Drill down into your user journeys to reveal your biggest customer pain points and optimization opportunities.

Elevate your customers' digital journeys
Learn about the current state of Digital Experience Analytics and what Contentsquare can offer.


