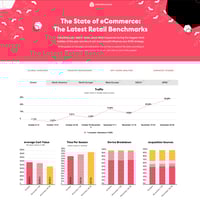
The State of eCommerce: The Latest Retail Benchmarks
Everything you need to know about what happened during the biggest retail holiday of the year and how it can (and should) influence your 2021 strategy. You'll get:
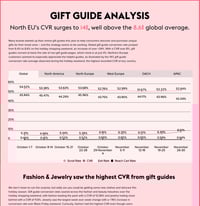
Expert analysis across the metrics you care about including gift guide performance, checkout drop-off rates & more, based on 1,7+ billions sessions.
P.S. This isn't another PDF, it's an interactive website experience!