
![]()

Charlotte Zwanenburg is G-star’s CRO Manager, sitting within the Digital Commercial team. Responsible for managing conversion rate optimization, Charlotte’s role includes driving A/B testing and personalization initiatives to improve their customer experience. “I’m trying to get the highest margin and return from everything we do,” she explains.
Alongside Charlotte is Laura Rademaker; a Customer Experience Manager who manages both product owners and UX specialists within the Digital Operations team. “I’m in charge of ensuring the customer has the best possible experience on our site and becomes a loyal returning customer.”
About G-Star
G-star is a luxury fashion brand dedicated to the cloth, craft, culture, and history of denim. “We want to be the most hardcore denim brand,” says Laura. “Denim is in our blood. It's what we live and breathe.”
This means every digital interaction a customer has with their brand needs to demonstrate their essence and these values. But not just that: “We want to exceed their expectations, so every time they visit us they come back thinking the experience was the most on-brand and amazing experience they’ve ever had,” says Laura.
Each customer needs to feel as though the content they received was relevant to them and fitted their needs. “We believe in being fierce, authentic, and outspoken—so we should show this to our customers,” says Laura. But, as a brand, how do you know if you’re actually achieving this?
Taking it back to basics
The team at G-star wanted to measure how their customer experience was performing in light of their brand goals. However, like many digital teams, they weren’t sure where to begin. “You have heaps of data everywhere and can feel unorganized and chaotic. You’re not sure where to find the information you need to make the right product decisions,” says Laura.
So the team decided to start by learning what the different levels of customer experience involved before working out how to accurately track their progress against each level.
Here’s what they found…
The different levels of CX
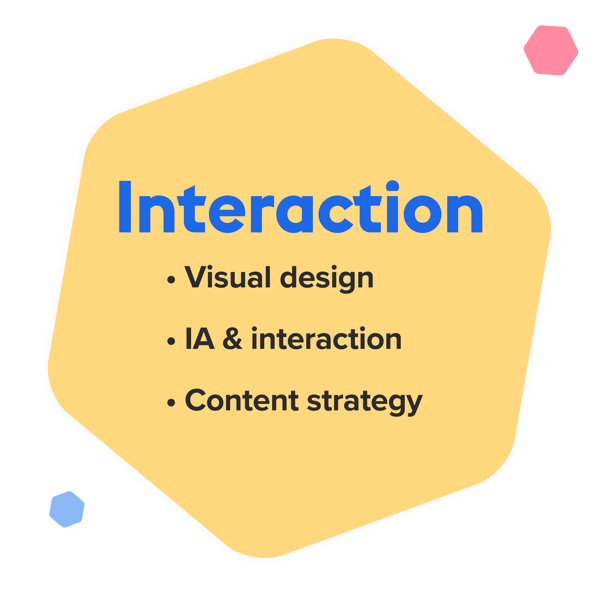
Interaction. “Firstly, there’s the interaction level: the specific touchpoint a customer has with your product,” explains Laura. “Things that affect the interaction level are the information architecture of your site, for example. Or your visual design, which also includes the quality of your product.”
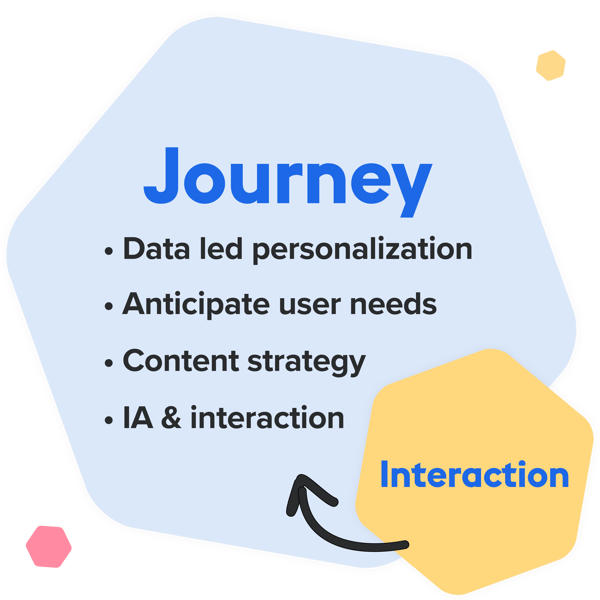
Customer journey. Each interaction happens at a specific point in time, so the next level of customer experience is an in-depth understanding of your customer journey. “We need to anticipate customer needs, understand where they’ve been and where they’re trying to go,” she continues. It’s all about giving your customers a consistent experience so they build confidence with the brand.
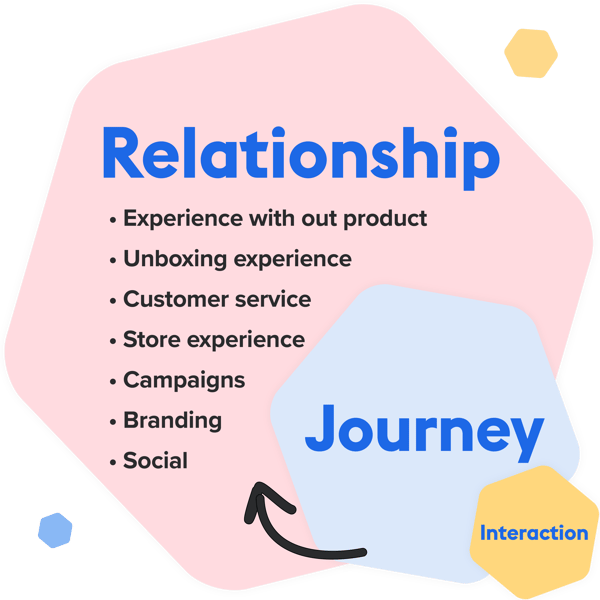
Relationship. Beyond the customer journey is the relationship you have with your customers. “It’s the sum of all interactions and journeys and is ultimately how your customers feel about your brand,” says Laura.
“Things that impact the relationship stage can be the experience they have with your product, whether it’s a digital product or a physical one. It’s any touchpoint they have along the customer journey, from speaking to customer services to purchasing something. And it’s also your branding.”
Do you live and breathe your brand values, and is this evident in all of your interactions and journeys? Is your marketing team delivering content that accurately reflects the experience your product actually offers? All of these things help to build a relationship with your customer, and they’re imperatively important.
Armed with this understanding of customer experience levels, it was time for the team to start tracking their progress. But how can you measure if your brand is delivering the customer experience you think it is? What metrics do you need to measure? And are your typical analytics tools enough?
A framework for success
To analyze their customer experience, the team turned to Google’s HEART Framework for a holistic view of their data points. Here’s what the framework looks like:
- H is for happiness: How do customers feel about your product? This is measured through metrics such as satisfaction surveys, ratings, reviews, or NPS scores.
- E is for engagement: How often do customers return to your brand? This is measured through metrics such as visits, session length, and pages viewed.
- A is for adoption: Do customers become new users or converters? This is measured through metrics such as the conversion rate of new versus returning users and account signups.
- R is for retention: Do customers like our product enough to buy it again? This is measured through metrics such as churn rate, repeat purchases, and app usage.
- T is for test success: Can users achieve their goal quickly and easily? This is measured through metrics such as time on specific tasks (i.e. the time to complete a checkout flow), surveys with goal completion rates, and customer effort score to understand if there are bottlenecks.
Maximizing conversation rates using the HEART Framework
As G-Star’s CRO Manager, Charlotte owns the conversion phase of the customer journey, where she measures performance across the entire HEART Framework. Let’s take a look at what this process looks like for three key metrics: Happiness, Engagement, and Task Success.
Happiness: Measuring how customers feel during the checkout process
“We have a Usabilla survey on the confirmation page after a transaction where we ask customers to rate their experience with G-star. Of course, the positive reviews are nice and give you a good feeling, but we’re mostly concerned with the negative reviews.” Because that’s where you really learn how to improve your customer experience.
When one user left negative feedback about difficulty inputting a phone number, the team saw an opportunity to improve. Charlotte dived straight into Contentsquare’s advanced digital analytics to view the session replay of the dissatisfied user to see exactly what the problem was. She could see exactly where the frustration had come from the user in question and was able to make a plan to remove the friction.
Session replay reconstructs an individual visitor session on your website to help you quickly troubleshoot why a certain metric is happening or to confirm a specific hypothesis.
But she also wanted to know if this was an issue that ran deeper than one single user. So she used Contentsquare’s zoning analysis to look into the problem. She was surprised to find that, actually, a lot of users weren’t able to successfully complete the form, causing many of them to drop off or leave fields blank.
- 69.9% of users left blank fields
- 15.6% of users dropped off from the form
Zoning analysis gives you intuitive visualizations about your customer behavior by overlaying key UX metrics directly onto your website. You can use zoning analysis to uncover common friction points within your customer journey.
“We looked even deeper and found that, as expected, the phone number field had the highest drop-off rate, with many users having to refill the field,” she explains. This advanced engagement insight—not available in typical analytics tools—allowed them to make a data-driven decision to run an A/B test: to find out whether making the phone number field option would help improve conversation rates.
Engagement: Are customers engaged enough to place large orders?
“Average order value is the metric we measure here,” explains Charlotte. “We launched an A/B test comparing two variations of the cart page: one with a recommendation module and one without” so see which caused a higher average order value and drove more revenue for the business.
“Using Contentsquare’s advanced analytics, we found the recommender module was the second most attractive element in our shopping cart, which had a big impact on our average order value.” Proving with concrete data that to improve their engagement score in line with the heart framework, it was important to keep the recommendations module in the cart.
Task success: How easily can customers complete their purchase?
“We use Contentsquare insights to measure this one too,” says Charlotte. “We identified the checkout shipping step was causing issues for users, with many of them trying to click multiple times on the same button.”
Charlotte took a look into session replay again, where she found the user scrolling around on the shipping page, seemingly unsure how to proceed to the next step. “They click on a button, but nothing happens. We saw that a lot of users had the same issue, causing them to click back a step or drop out of the funnel entirely because they don’t understand what’s going wrong.”
Looking closer, Charlotte noticed the error was caused by the user failing to fill in their shipping address to proceed to the next step. However, with no clear error message to tell him this, he bounced instead.
The quick win? Contentsquare’s advanced engagement analytics allowed the team at G-star to find the error quickly and correct it. “We added an error message beneath the shipping address module to explain it was a requirement,” explains Charlotte. A small tweak which made a big difference given the traffic to their site.
Ecommerce
Prioritizing digital transformation as the world shifts to mobile: TomTom on their latest app experience
Ecommerce
User research, digital intelligence, and a testing-obsessed mindset: The recipe for success according to Moss Bros
Ecommerce
The perfect fit: How Sweaty Betty is enticing US customers with the help of Contentsquare

![]()