2026 Digital Experience Benchmarks for Marketing Leaders
See where your acquisition and engagement metrics compare, and what to prioritize when costs rise and channels shift.
The marketing playbook is shifting. Discovery is moving beyond traditional search, acquisition costs are climbing, and repeat visitors are becoming your most reliable path to growth.
The 2026 Benchmarks show how marketing leaders are adapting: investing in repeat visitors, optimizing for stronger intent, and turning fewer, harder-won sessions into sustainable performance. See where you stand, and what to prioritize to turn pressure into performance.
Key KPIs
-
Acquisition & traffic mix
Why it matters:
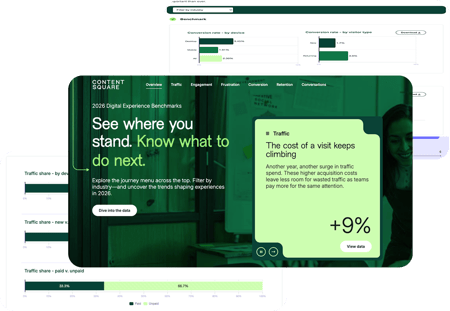
AI is reshaping discovery. Organic search is down -9%, and the cost of a visit is rising (+9% YoY). Understanding which channels deliver high-intent traffic is critical.
Top insights:
- AI-referred traffic: up +632% year over year (though still just 0.2% of total visits)—small but growing fast
- Organic search traffic: down -9%—traditional discovery is declining
- Paid social traffic: up +18%, now 10.5% of all traffic—requires more budget to maintain volume
- Bounce rates by source: AI-referred visitors (-5%), organic search (-4%), paid search (-3%)—lower bounce = stronger intent
How to beat the benchmark
Rebalance spend toward high-intent channels. Tighten ad-to-landing message match and optimize for AI-influenced discovery (structured content, clear value above the fold).
-
Engagement & intent signals
Why it matters:
Consumption is down -10%, but intent is strengthening. Visitors arrive more informed and expect immediate relevance.
Top insights:
- Bounce rate by source: lower bounce rates signal visitors arrived with stronger intent and found what they needed
- Time on site: down -7%—sessions are getting shorter overall
- Desktop vs. mobile time: desktop represents 30% of visits but captures 47% of total time spent, indicating deeper, more intentional sessions
- Activity rates: clicks, taps, and engagement on homepage, product pages, and key conversion pages
How to beat the benchmark
Refine hero hierarchy and above-the-fold value. Use zone-based heatmaps to optimize first impressions. Design desktop experiences for high-intent, comparison moments.
-
Retention & repeat visitors
Why it matters:
Repeat visitors now account for 53% of visits (down just -2% vs. -5.8% for new traffic). Brands with the highest returning visitor share see +35% higher conversion (Retail).
Top insights:
- Share of repeat vs. new visitors: repeat visitors now make up 53% of all traffic
- Conversion rate for returning visitors: higher than first-time visitors—they convert more reliably
- Pages per session for repeat visitors: +2.3 more pages than new visitors, showing deeper engagement
- Retention trends: are customers coming back within 7 or 30 days?
How to beat the benchmark
Map journeys for repeat visitors to identify what brings them back. Invest in retention analysis, email re-engagement, and personalized return experiences.
Top insights:
- AI-referred traffic: up +632% year over year (though still just 0.2% of total visits)—small but growing fast
- Organic search traffic: down -9%—traditional discovery is declining
- Paid social traffic: up +18%, now 10.5% of all traffic—requires more budget to maintain volume
- Bounce rates by source: AI-referred visitors (-5%), organic search (-4%), paid search (-3%)—lower bounce = stronger intent
How to beat the benchmark
Rebalance spend toward high-intent channels. Tighten ad-to-landing message match and optimize for AI-influenced discovery (structured content, clear value above the fold).
Top insights:
- Bounce rate by source: lower bounce rates signal visitors arrived with stronger intent and found what they needed
- Time on site: down -7%—sessions are getting shorter overall
- Desktop vs. mobile time: desktop represents 30% of visits but captures 47% of total time spent, indicating deeper, more intentional sessions
- Activity rates: clicks, taps, and engagement on homepage, product pages, and key conversion pages
How to beat the benchmark
Refine hero hierarchy and above-the-fold value. Use zone-based heatmaps to optimize first impressions. Design desktop experiences for high-intent, comparison moments.
Top insights:
- Share of repeat vs. new visitors: repeat visitors now make up 53% of all traffic
- Conversion rate for returning visitors: higher than first-time visitors—they convert more reliably
- Pages per session for repeat visitors: +2.3 more pages than new visitors, showing deeper engagement
- Retention trends: are customers coming back within 7 or 30 days?
How to beat the benchmark
Map journeys for repeat visitors to identify what brings them back. Invest in retention analysis, email re-engagement, and personalized return experiences.
For marketing leaders, the takeaway is clear: adapt to a new discovery landscape, invest in customers who already know the brand, and continually optimize digital experiences.
By accommodating the strong intent from new arrivals and using what’s known about returning visitors, brands can turn fewer, harder-won sessions into sustainable growth.
Put the benchmarks to work
Use the Benchmark Data Explorer to filter by your industry and compare how your traffic mix, engagement rates, and repeat visitor performance stack up against relevant peers. Spot the KPIs where you're below the benchmark, and the journey stages where small fixes can deliver measurable lift.