Everyone is unique. Know what makes them click.


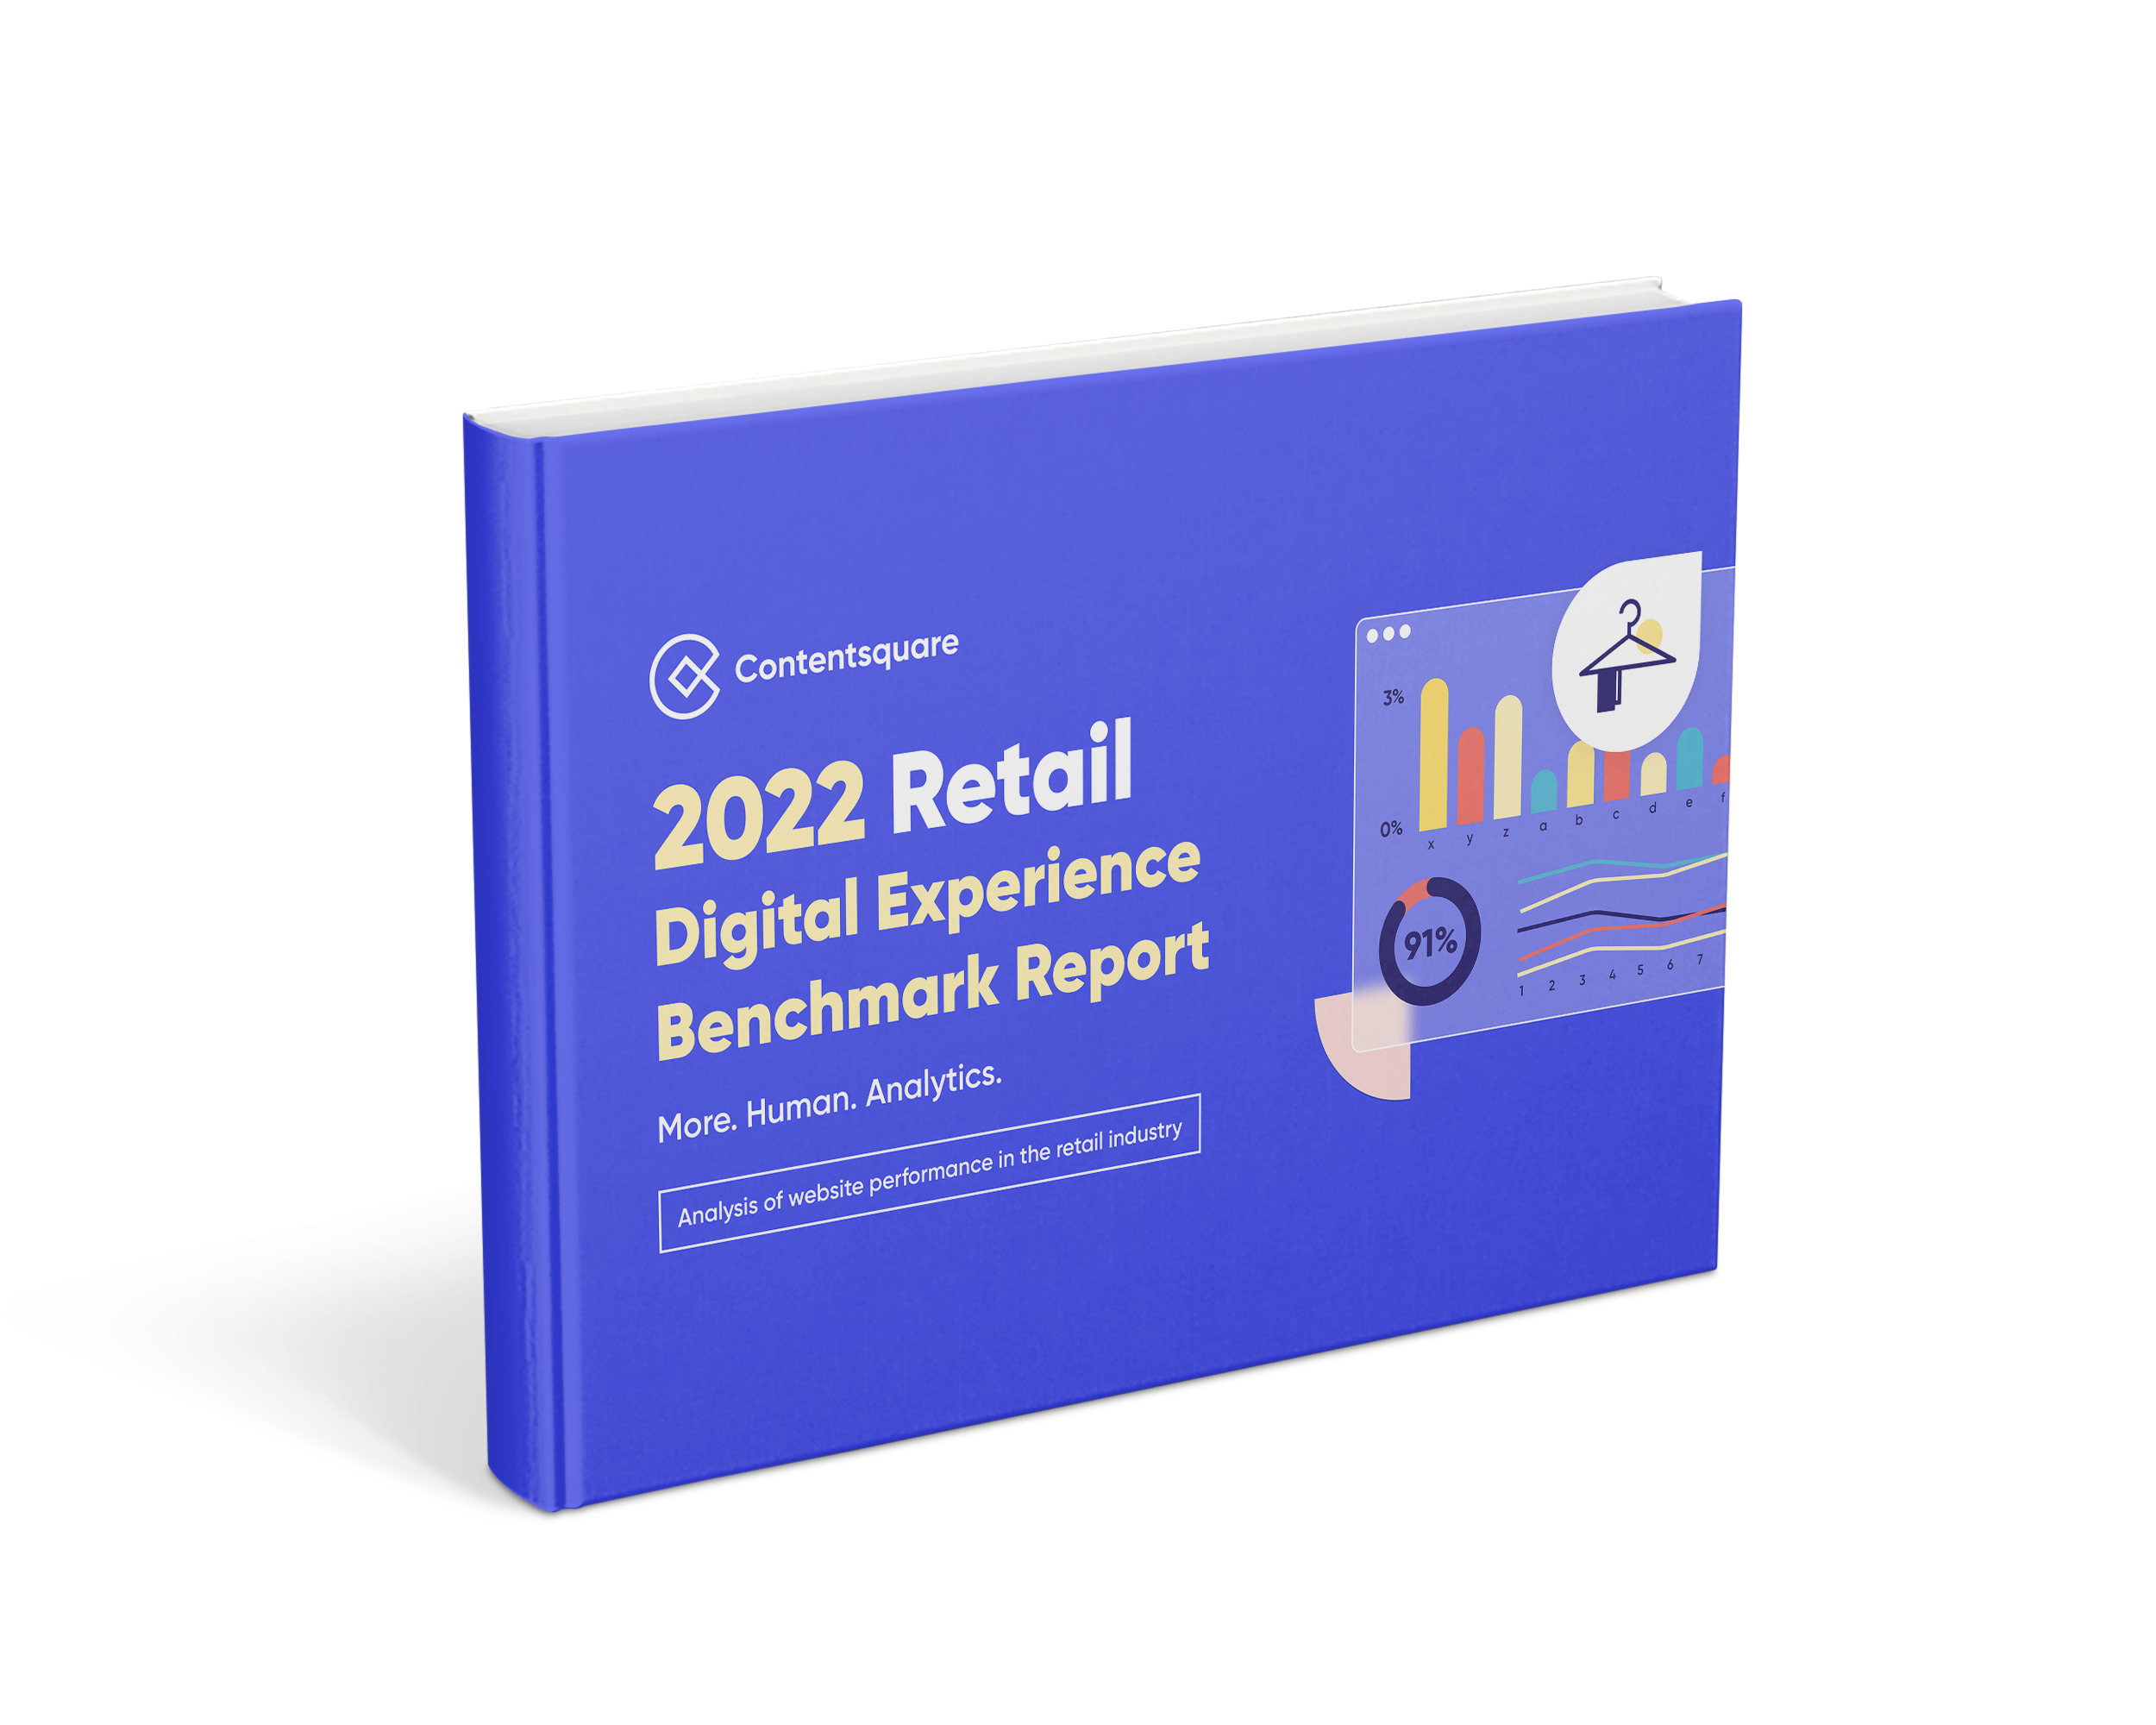
2022 Retail Digital Experience Benchmark Report

Conversion rates for retailers increased by 26% in 2021. Get the insights you need to deliver better, more human digital experiences.

Benchmark-Spin-off-Report-Retail-Mockup


Get the report

x

Benchmark-LP-InsideReportSection-art1


INSIDE THE REPORT

See how your website stacks up against data based on 28.9+ billion retail user sessions

  • Insights into where you fall within the retail industry's competitive landscape
  • Expert analysis and guidance to improve your digital CX and help your brand stand out
  • Strategic data to help you make informed updates to your digital strategy
  • …and a whole load of talking points to ensure you sound suave in your next team meeting

Key Findings

Across over 100 metrics and billions of data points.

keyfindings-1

Site Entry

  • 66% of all retail web traffic is mobile
  • 49% of visitors are returning users
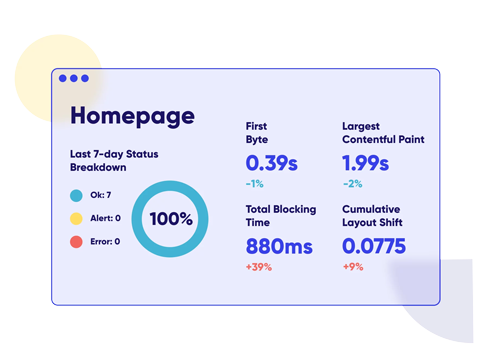
keyfindings-2

Site Experience

  • 51% average scroll rate for visitors on retail websites
  • 48% of visitors bounce after viewing just one page
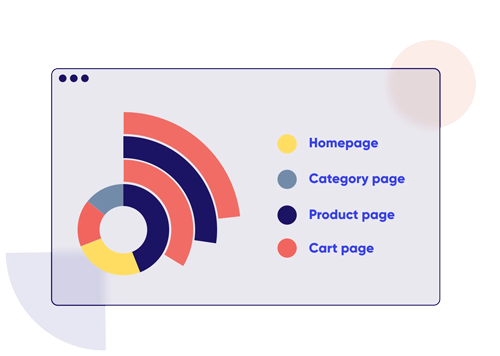
keyfindings-3

Conversion

  • 2.5% average conversion rate
  • 17 minutes and 46 seconds average time spent during conversion sessions

The Dataset

Contentsquare integrates directly with 70+ leading marketing tools, supercharging your systems with unique insight into your customers. We make your entire ecosystem smarter, giving you a greater return on your marketing tech stack investment.

Group - people

12 Months of Data

CS Digital

2,031 Retail Websites

World - earth

25 Countries

Desktop

28.9+ Billion User Sessions

DOWNLOAD THE REPORT

Ready to see how your website stacks up?

Download the Report

reportcta