RGB-vivid-logo (1)

2023 Travel and Hospitality Digital Experience Benchmark

Make every visit count this year with our user experience report

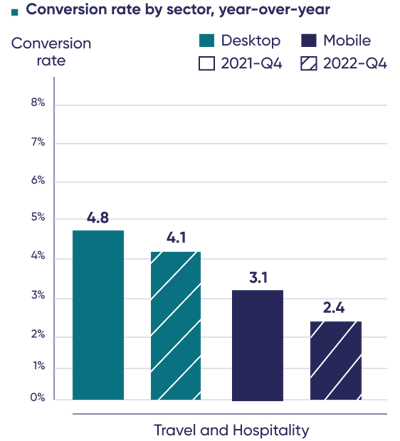
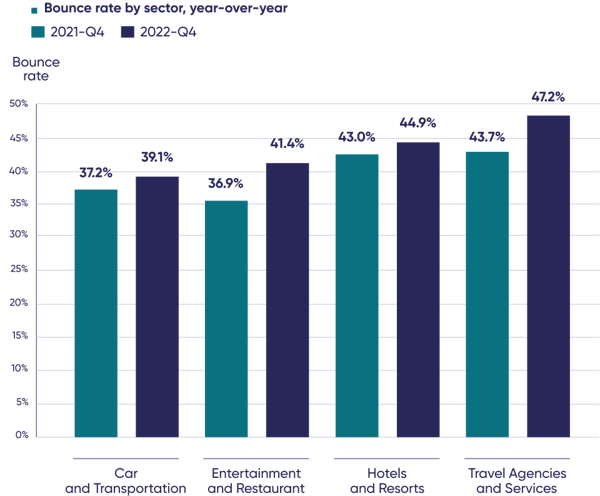
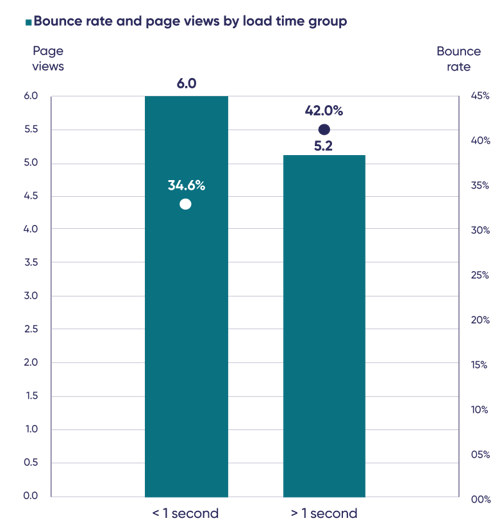
Bounces rose and conversions dropped on travel and hospitality sites last year, but speedy sites saw less bounces and paid traffic converted better. 

Measure what matters most to your site visitors. Optimize your digital customer experience for engagement, efficiency, customer satisfaction and ROI in 2023.

Access the full report

x
benchmark23_pageview

20.6 billion

Page views

benchmark23_click-rate

3.8 billion

Sessions

benchmark23_websites

106

Sites

benchmark23_countries

26

Countries

benchmark23-data-chart

4

Sectors

Cars & Transportation, Entertainment & Restaurant, Hotels & Resorts, Travel Agencies & Services

Preview of the travel and hospitality customer experience metrics inside

Conversion rates drop

Conversion rates on travel and hospitality sites fell -1.4% year-over-year. They fell on both desktop and mobile, and across all acquisition channels.


chart1x2

chart2x2

Bounce rates rise

Meanwhile, bounce rates rose across all four travel and hospitality sectors, peaking at 47.2% for Travel Agencies & Services. 

While these trends have numerous causes, including economic, together they point to something going amiss in travel and hospitality experiences.  

Consumption is down

Across the board and throughout the customer journey, metrics measuring the consumption of travel and hospitality site pages were down. 

These metrics are symptomatic of a growing consumption crisis, fuelled by ‘grazing’ behavior—that is, consumers making more frequent but shorter and shallower visits. 

chart3x2
chart4x2 2

User frustration is all-too common

With site visitors ‘grazing’ and leaving, there’s a heightened need to engage and delight them as soon as possible. Many sites, however, are frustrating them instead. 

41.4% of travel and hospitality site sessions were marred by frustration in 2022. Slow page loads were the leading cause of frustration, slamming the brakes on 21.1% of sessions.

Speedy sites see less bounces and deeper sessions

Accelerating page load times is a powerful way to decrease bounces and increase engagement. 

Sites that took less than a second to load had an average bounce rate of 34.6%—compared to 42% for sites that took longer than a second. Faster sites also earned almost a whole extra page view per session. 

chart5x2
chart6x2

Paid traffic and desktop traffic converts best

Mobile traffic drove 64.4% of visits to travel and hospitality sites in 2022—and unpaid traffic drove three out of four visits. 

However, in all but one sector, paid traffic had a higher conversion rate than unpaid—and desktop had a higher conversion rate across the board.

What's inside?

The 2023 Travel & Hospitality Digital Experience Benchmark explores the user experience on travel and hospitality sites from end-to-end, helping you pin-point opportunities to improve your customer journey, delight more customers and see real growth.

2023-travel-industry-icons-mosaic

Measure the whole digital traveler’s journey

It’s what’s inside the customer journey that really counts. Our report includes everything digital teams need to know about and invest in—not just traffic, bounces and outcomes. 

2023-travel-4-portraits

Who is this for?

From executives and decision makers to team leads and CX pros—anybody in need of strategic insights into how to optimize digital journeys for efficiency, customer satisfaction and growth.

Travel-and-Hospitality-mockup

Learn from the leaders

Get insights into improving your CX from top brands and leaders in Travel and Hospitality.

cover-report-u

See how your digital experiences stack up.

Demo video

Spend smarter. Operate leaner. Grow faster.

Discover how Contentsquare’s leading digital experience analytics platform helps over 1000 global brands grow revenue with exceptional digital customer experiences.

Watch the 1-minute product video or click below to access the full 6-minute version.