.png?width=220&height=52&name=RGB-vivid-logo%20(1).png)
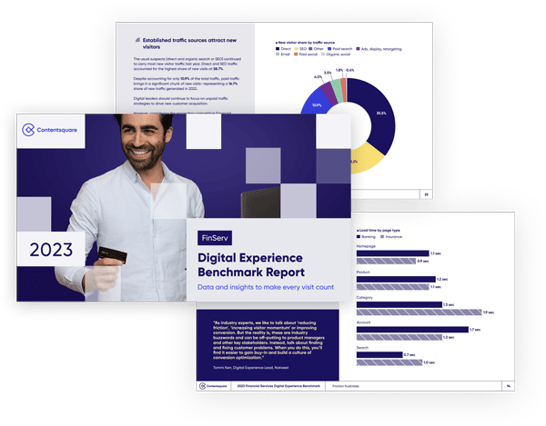
2023 Financial Services Digital Experience Benchmark
Make every visit count this year with our user experience report
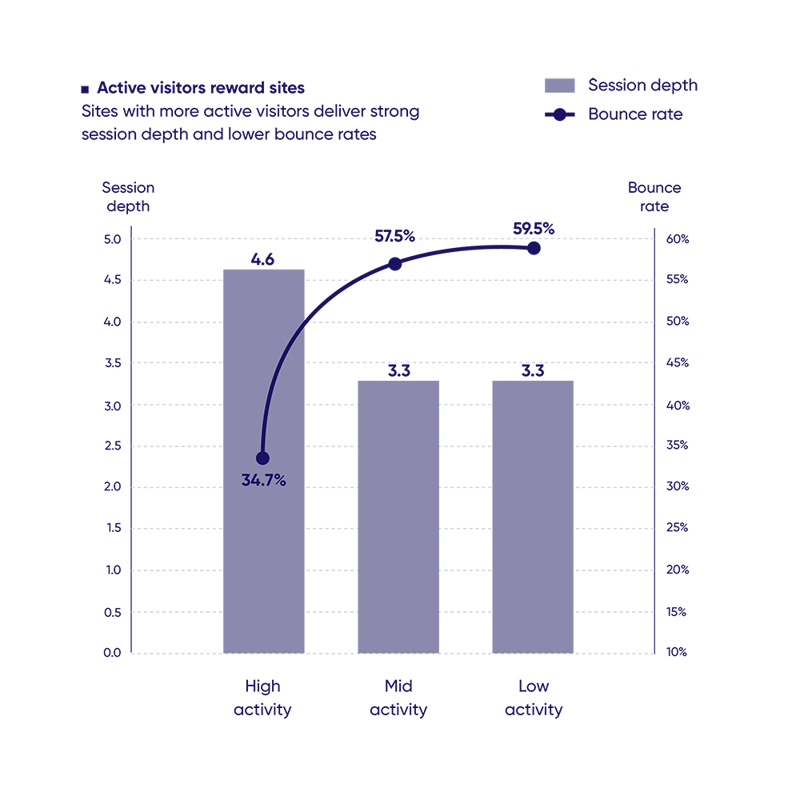
Financial Services sites with engaged visitors and low loading times see less bounces and more content consumption. Measure what matters most to your customers to optimize your experiences for engagement, efficiency, customer satisfaction and ROI.

9.4 billion
Page views

2.7 billion
Sessions

135
Sites

26
Countries

2
Sectors
Banking & Insurance

Measure the whole journey
It’s what’s inside the customer journey that really counts. Our report includes everything digital teams need to know about and invest in—not just traffic, bounces and outcomes.

Who is this for?
From executives and decision makers to team leads and CX pros, anybody at a Financial Services firm who needs strategic insights into how best to optimize digital journeys for efficiency, customer satisfaction and growth.

Learn from the leaders
Get insights into improving your CX from top brands and Financial Services industry leaders.